Sales Trend Analysis: Understanding Patterns for Strategic Growth
In the ever-evolving world of business, understanding sales trends is crucial for forecasting, inventory management, strategic decision-making, and overall business growth. Sales Trend Analysis is the systematic approach of reviewing sales data over specific periods to identify patterns or trends. These insights help businesses predict future sales, recognize seasonal impacts, and make informed strategic decisions.
What is Sales Trend Analysis?
Sales Trend Analysis involves examining historical sales data to identify consistent patterns or changes over time. By doing so, businesses can:
- Forecast Future Sales: Predict future sales performance based on past trends.
- Understand Seasonal Impacts: Recognize how seasons or specific times of the year affect sales.
- Manage Inventory: Optimize inventory levels to meet anticipated demand without overstocking.
- Make Strategic Decisions: Develop strategies based on past performance and anticipated future trends.
How to Conduct Sales Trend Analysis
Conducting Sales Trend Analysis requires a systematic approach to gathering and analyzing data. Here are the essential steps:
- Data Gathering: Compile historical sales data over a significant period. This could be weekly, monthly, or yearly data, depending on the business’s nature and requirements.
- Pattern Identification: Look for consistent patterns in the data. Identify peaks, troughs, and any correlations between specific events or seasons and changes in sales.
- Use of Analytical Tools: Employ statistical tools or software for a more detailed analysis. These tools can help identify complex patterns, such as trend lines in time series analysis.
- Comparative Analysis: Compare trends across different categories, regions, or customer segments. This helps understand relative performance and identify areas for improvement.
- Predictive Forecasting: Use the identified trends to forecast future sales. This could be as simple as projecting growth rates forward or using sophisticated predictive models.
Examples of Sales Trend Analysis
Seasonal Trends:
Understanding how seasons affect sales is crucial for many businesses. For instance, an ice cream company might notice that sales peak during summer and decline in winter. Recognizing this pattern helps in planning production schedules, inventory management, and targeted marketing campaigns during peak seasons.
Product Life Cycle Trends:
A product’s life cycle includes stages such as introduction, growth, maturity, and decline. By analyzing sales data, businesses can identify which stage a product is in. For example, if sales of a particular product have been steadily declining over the past few quarters, it may indicate that the product is reaching the end of its life cycle. This insight can prompt decisions about discontinuing the product or innovating to revive its appeal.
Promotional Impact Trends:
Promotional campaigns can significantly impact sales. By analyzing sales data during and after promotions, businesses can evaluate the effectiveness of their marketing efforts. For example, a retailer might observe a sales spike during a holiday promotion, indicating the campaign’s success. This information can guide future marketing strategies and budget allocation.
Tools and Techniques for Sales Trend Analysis
Statistical Analysis:
Statistical tools such as regression analysis, moving averages, and exponential smoothing can help identify trends and make predictions. These methods analyze historical data to reveal underlying patterns and forecast future sales.
Time Series Analysis:
Time series analysis involves analyzing data points collected or recorded at specific time intervals. It helps identify trends, seasonal patterns, and cyclical movements. Techniques like ARIMA (AutoRegressive Integrated Moving Average) and SARIMA (Seasonal ARIMA) models are commonly used in time series analysis for more accurate forecasting.
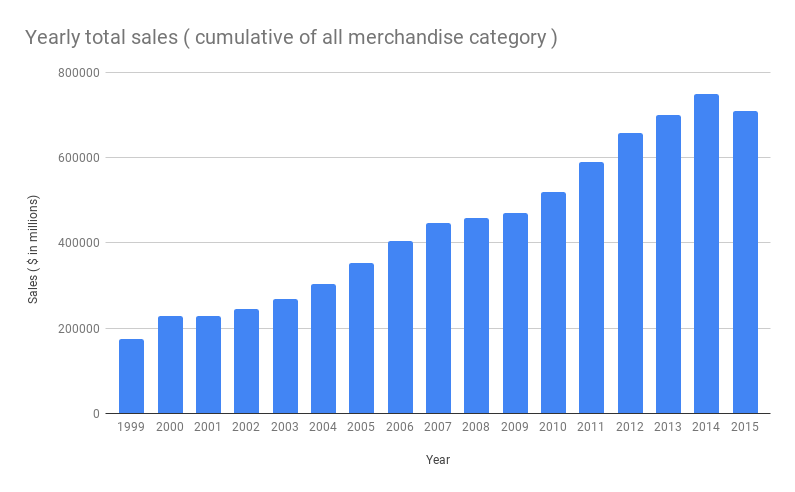
Data Visualization:
Visualization tools like graphs, charts, and dashboards are essential for presenting sales data in an easily understandable format. Tools like Tableau, Power BI, and Excel offer powerful visualization capabilities that can highlight trends and patterns in sales data.
Machine Learning Models:
Advanced machine learning models, such as neural networks and decision trees, can analyze large datasets to uncover complex patterns. These models can provide highly accurate sales forecasts by considering various factors, including historical sales data, market conditions, and external influences.
Importance of Comparative Analysis
Comparative analysis involves comparing sales trends across different dimensions, such as product categories, regions, or customer segments. This analysis helps businesses understand relative performance and identify opportunities for growth.
Category Analysis:
By comparing sales trends across different product categories, businesses can identify high-performing and underperforming products. This information helps in product development, marketing strategies, and inventory management.
Regional Analysis:
Comparing sales trends across different regions can reveal geographical variations in demand. For example, a clothing retailer might find that winter clothing sales are higher in colder regions. This insight can guide regional marketing efforts and inventory distribution.
Customer Segment Analysis:
Analyzing sales trends across different customer segments helps businesses understand their target audience better. For instance, a company might find that a particular product is popular among younger customers. This information can inform targeted marketing campaigns and product development strategies.
Predictive Forecasting Techniques
Predictive forecasting uses historical sales data and identified trends to project future sales. Several techniques can be used for predictive forecasting:
Trend Projection:
This simple method involves extending the identified trend line into the future. It assumes that the factors driving past trends will continue to influence future sales.
Seasonal Decomposition:
This technique separates time series data into trend, seasonal, and irregular components. By understanding each component, businesses can make more accurate forecasts that account for seasonality and underlying trends.
Econometric Models:
Econometric models use statistical techniques to analyze the relationship between sales and various influencing factors, such as price, advertising spend, and economic conditions. These models can provide insights into how changes in these factors might impact future sales.
Machine Learning Models:
Advanced machine learning models can analyze large datasets and identify complex patterns. These models can provide highly accurate sales forecasts by considering various factors, including historical sales data, market conditions, and external influences.
Case Studies in Sales Trend Analysis
Case Study 1: Seasonal Trends in Retail
A retail company specializing in holiday decorations used sales trend analysis to optimize its inventory and marketing strategies. By analyzing historical sales data, the company identified that sales peaked during the months leading up to major holidays. This insight allowed the company to stock up on inventory and launch targeted marketing campaigns well in advance of these peak periods, resulting in increased sales and reduced stockouts.
Case Study 2: Product Life Cycle Trends in Electronics
An electronics manufacturer observed declining sales for one of its flagship products. By conducting a sales trend analysis, the company identified that the product had reached the maturity stage of its life cycle. This prompted the company to innovate and launch a new version of the product with enhanced features, revitalizing sales and extending the product’s life cycle.
Case Study 3: Promotional Impact Trends in FMCG
A fast-moving consumer goods (FMCG) company ran a series of promotional campaigns and wanted to evaluate their effectiveness. By analyzing sales data during and after the promotions, the company identified which campaigns generated the most significant sales spikes. This information guided future marketing strategies, helping the company allocate its marketing budget more effectively.
Sentiment Analysis: Understanding Customer Emotions
While quantitative sales data provides valuable insights into sales trends, understanding the qualitative aspects of customer behavior is equally important. Sentiment analysis involves extracting and interpreting customer sentiments from various data sources, such as social media, customer reviews, and surveys. This analysis provides a deeper understanding of customer attitudes and emotions toward a brand or product.
Sentiment Analysis Techniques:
- Natural Language Processing (NLP):
NLP techniques are used to analyze text data and identify positive, negative, or neutral sentiments. Tools like sentiment lexicons, machine learning models, and deep learning algorithms can process large volumes of text data to extract sentiment scores. - Social Media Monitoring:
Social media platforms are rich sources of customer feedback. Monitoring social media conversations about a brand or product can provide real-time insights into customer sentiments. Tools like Hootsuite, Brandwatch, and Sprout Social can help track and analyze social media mentions. - Customer Reviews and Surveys:
Analyzing customer reviews and survey responses can reveal customer satisfaction levels and identify areas for improvement. Sentiment analysis tools can process these textual data sources to provide actionable insights. - Text Mining:
Text mining techniques involve extracting valuable information from unstructured text data. This includes identifying keywords, phrases, and patterns that indicate customer sentiments. Text mining tools like RapidMiner and KNIME can facilitate this process.
Integrating Sentiment Analysis with Sales Trend Analysis:
Combining sentiment analysis with sales trend analysis provides a comprehensive view of market dynamics and customer preferences. For example, a company might observe a spike in sales following a positive social media campaign. Sentiment analysis can confirm that the campaign generated positive customer sentiments, validating its effectiveness.
Implementing Sales Trend Analysis: Best Practices
- Data Quality:
Ensure that the data used for analysis is accurate, complete, and up-to-date. High-quality data is essential for reliable insights and accurate forecasts. - Regular Monitoring:
Conduct sales trend analysis regularly to stay informed about changing market conditions and emerging trends. Regular monitoring helps in making timely and informed decisions. - Collaborative Approach:
Involve different departments, such as sales, marketing, finance, and operations, in the analysis process. A collaborative approach ensures that insights are comprehensive and actionable. - Actionable Insights:
Focus on generating actionable insights that can inform strategic decisions. Insights should lead to specific actions, such as adjusting inventory levels, launching marketing campaigns, or developing new products. - Continuous Improvement:
Continuously refine the analysis process by incorporating new data sources, advanced analytical techniques, and feedback from stakeholders. Continuous improvement ensures that the analysis remains relevant and valuable.
Conclusion
Sales Trend Analysis is a powerful tool for understanding historical sales performance, forecasting future trends, and making strategic business decisions. By systematically gathering and analyzing sales data, businesses can identify patterns, understand seasonal impacts,